VsSurf® software is designed with the user in mind. Created for application across several disciplines, the software is closely supported for ease of use. Below are examples of some of the many things you can do with VsSurf software.
-
![]()
QC in the field.
-
![]()
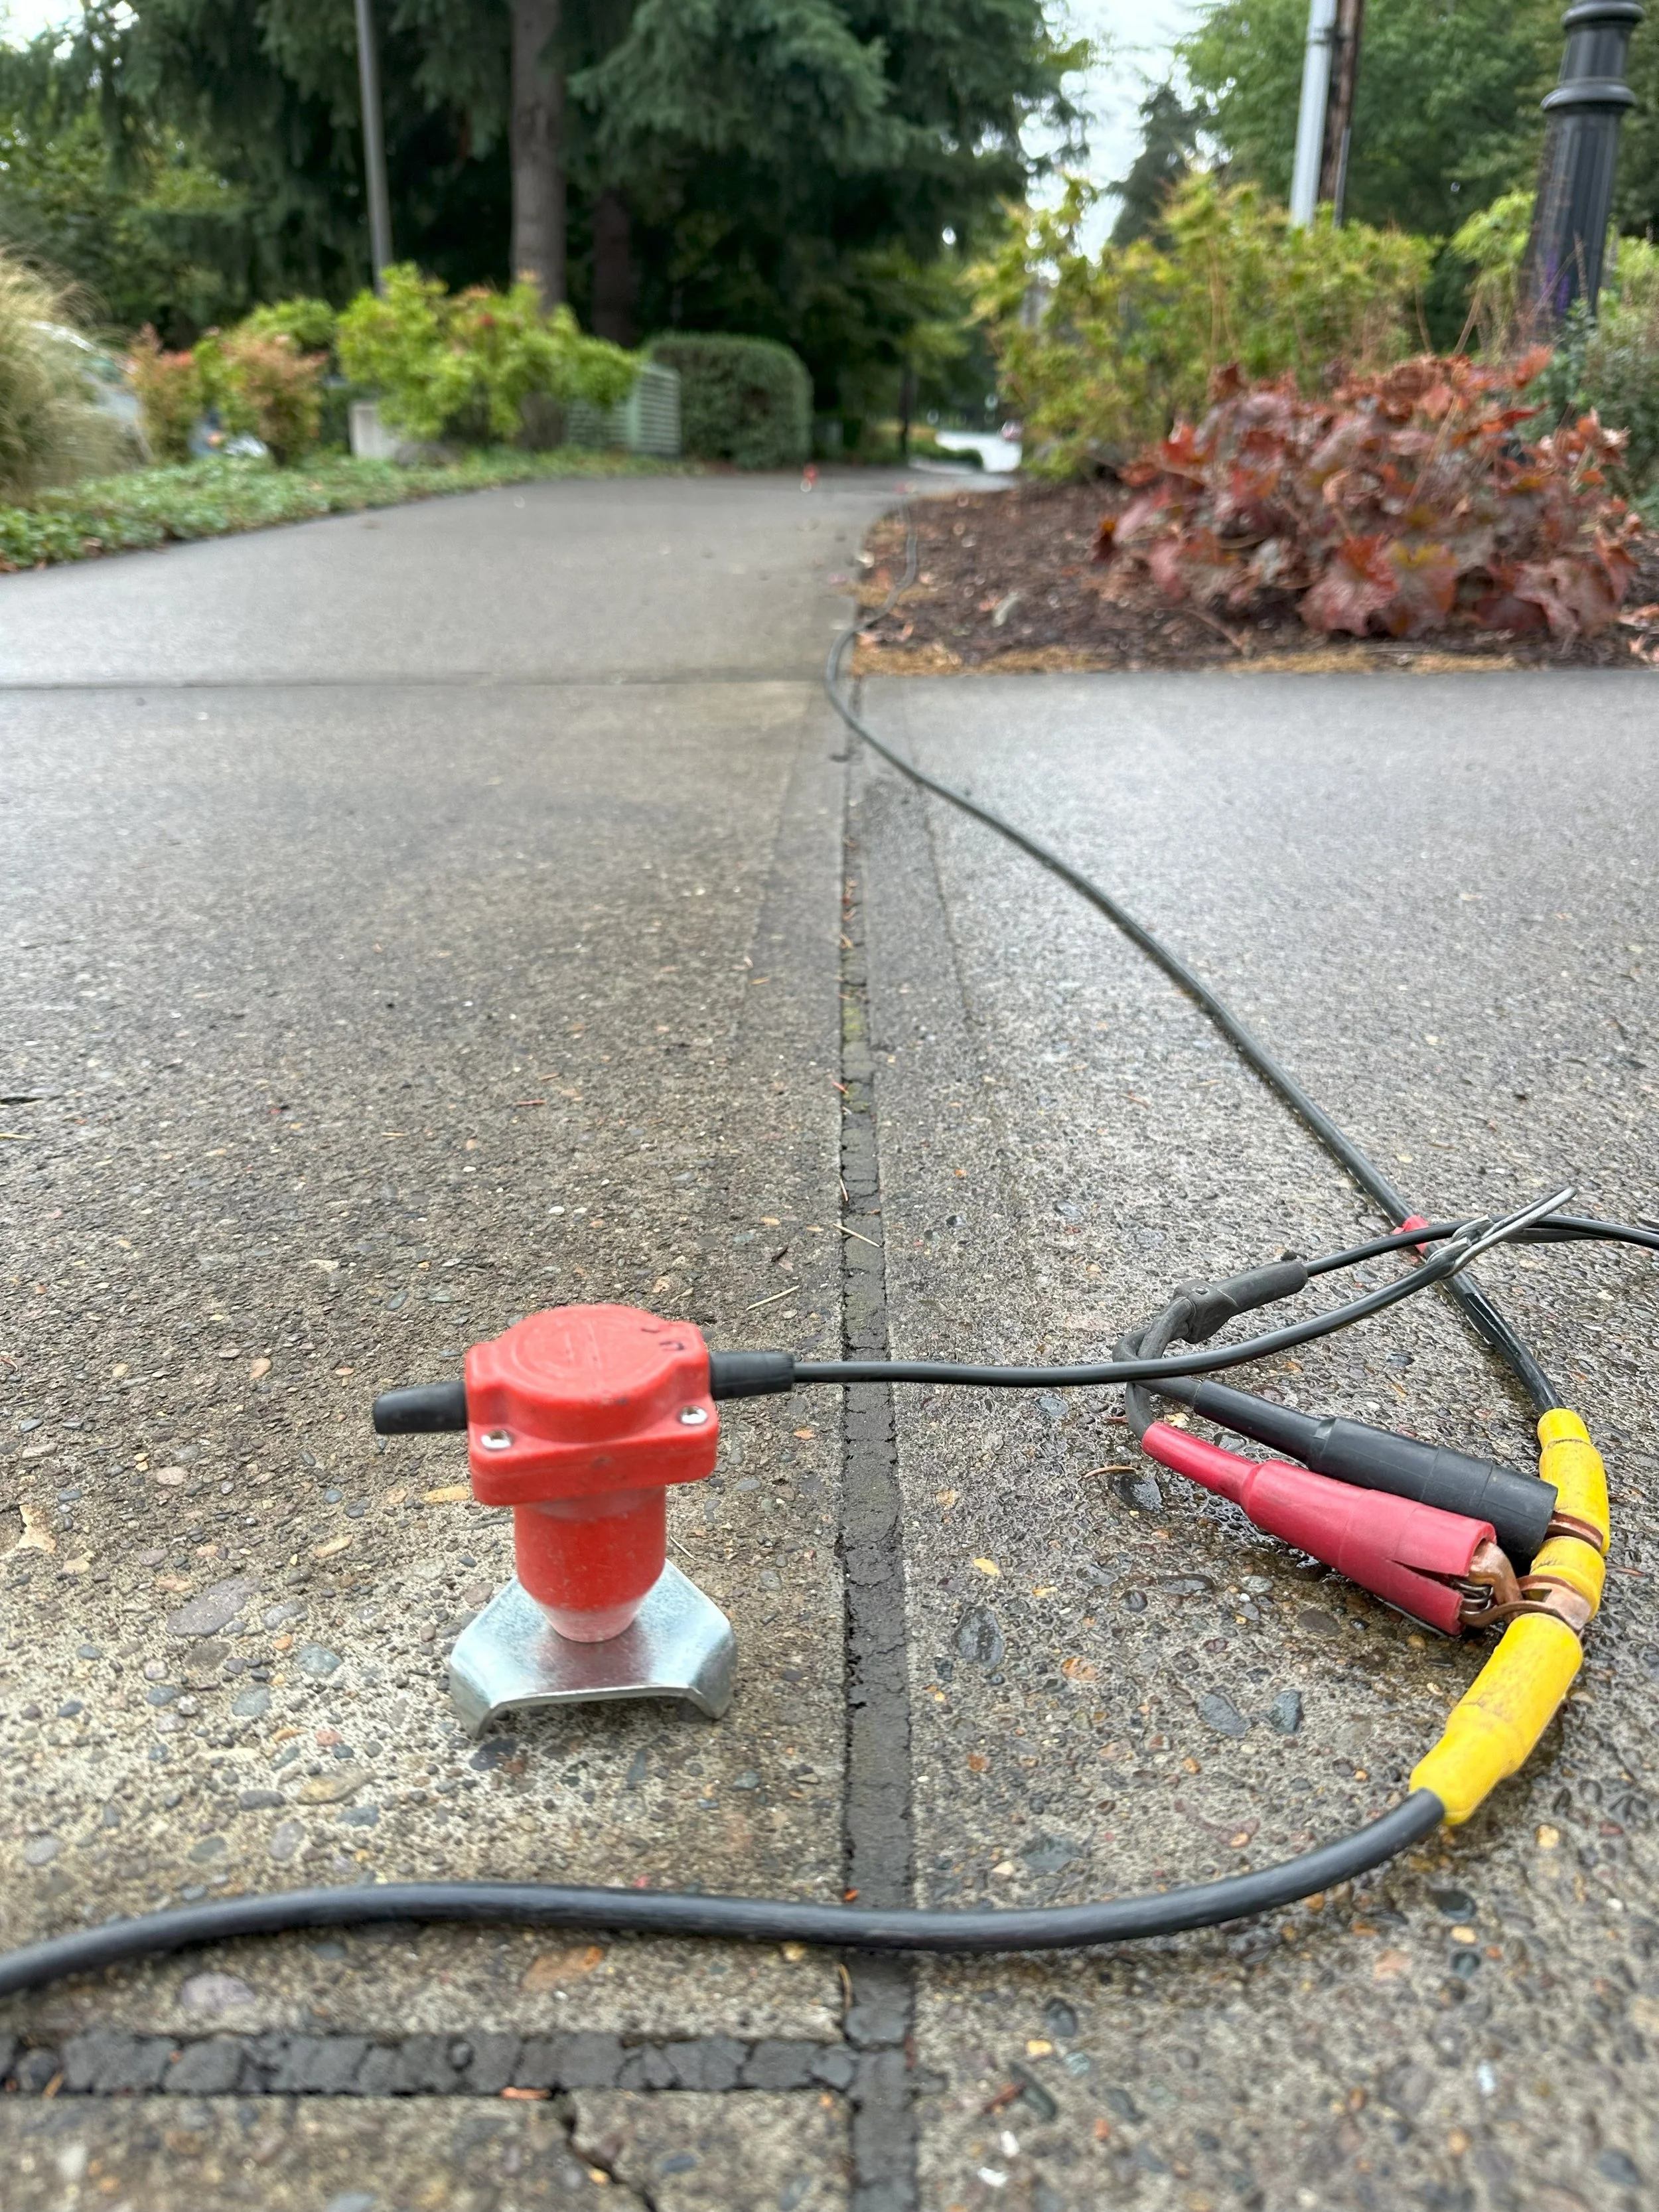
Non-intrusive.
-
![]()
Deploy anywhere.
-
![]()
Compact.
-
![]()
Easy travel.


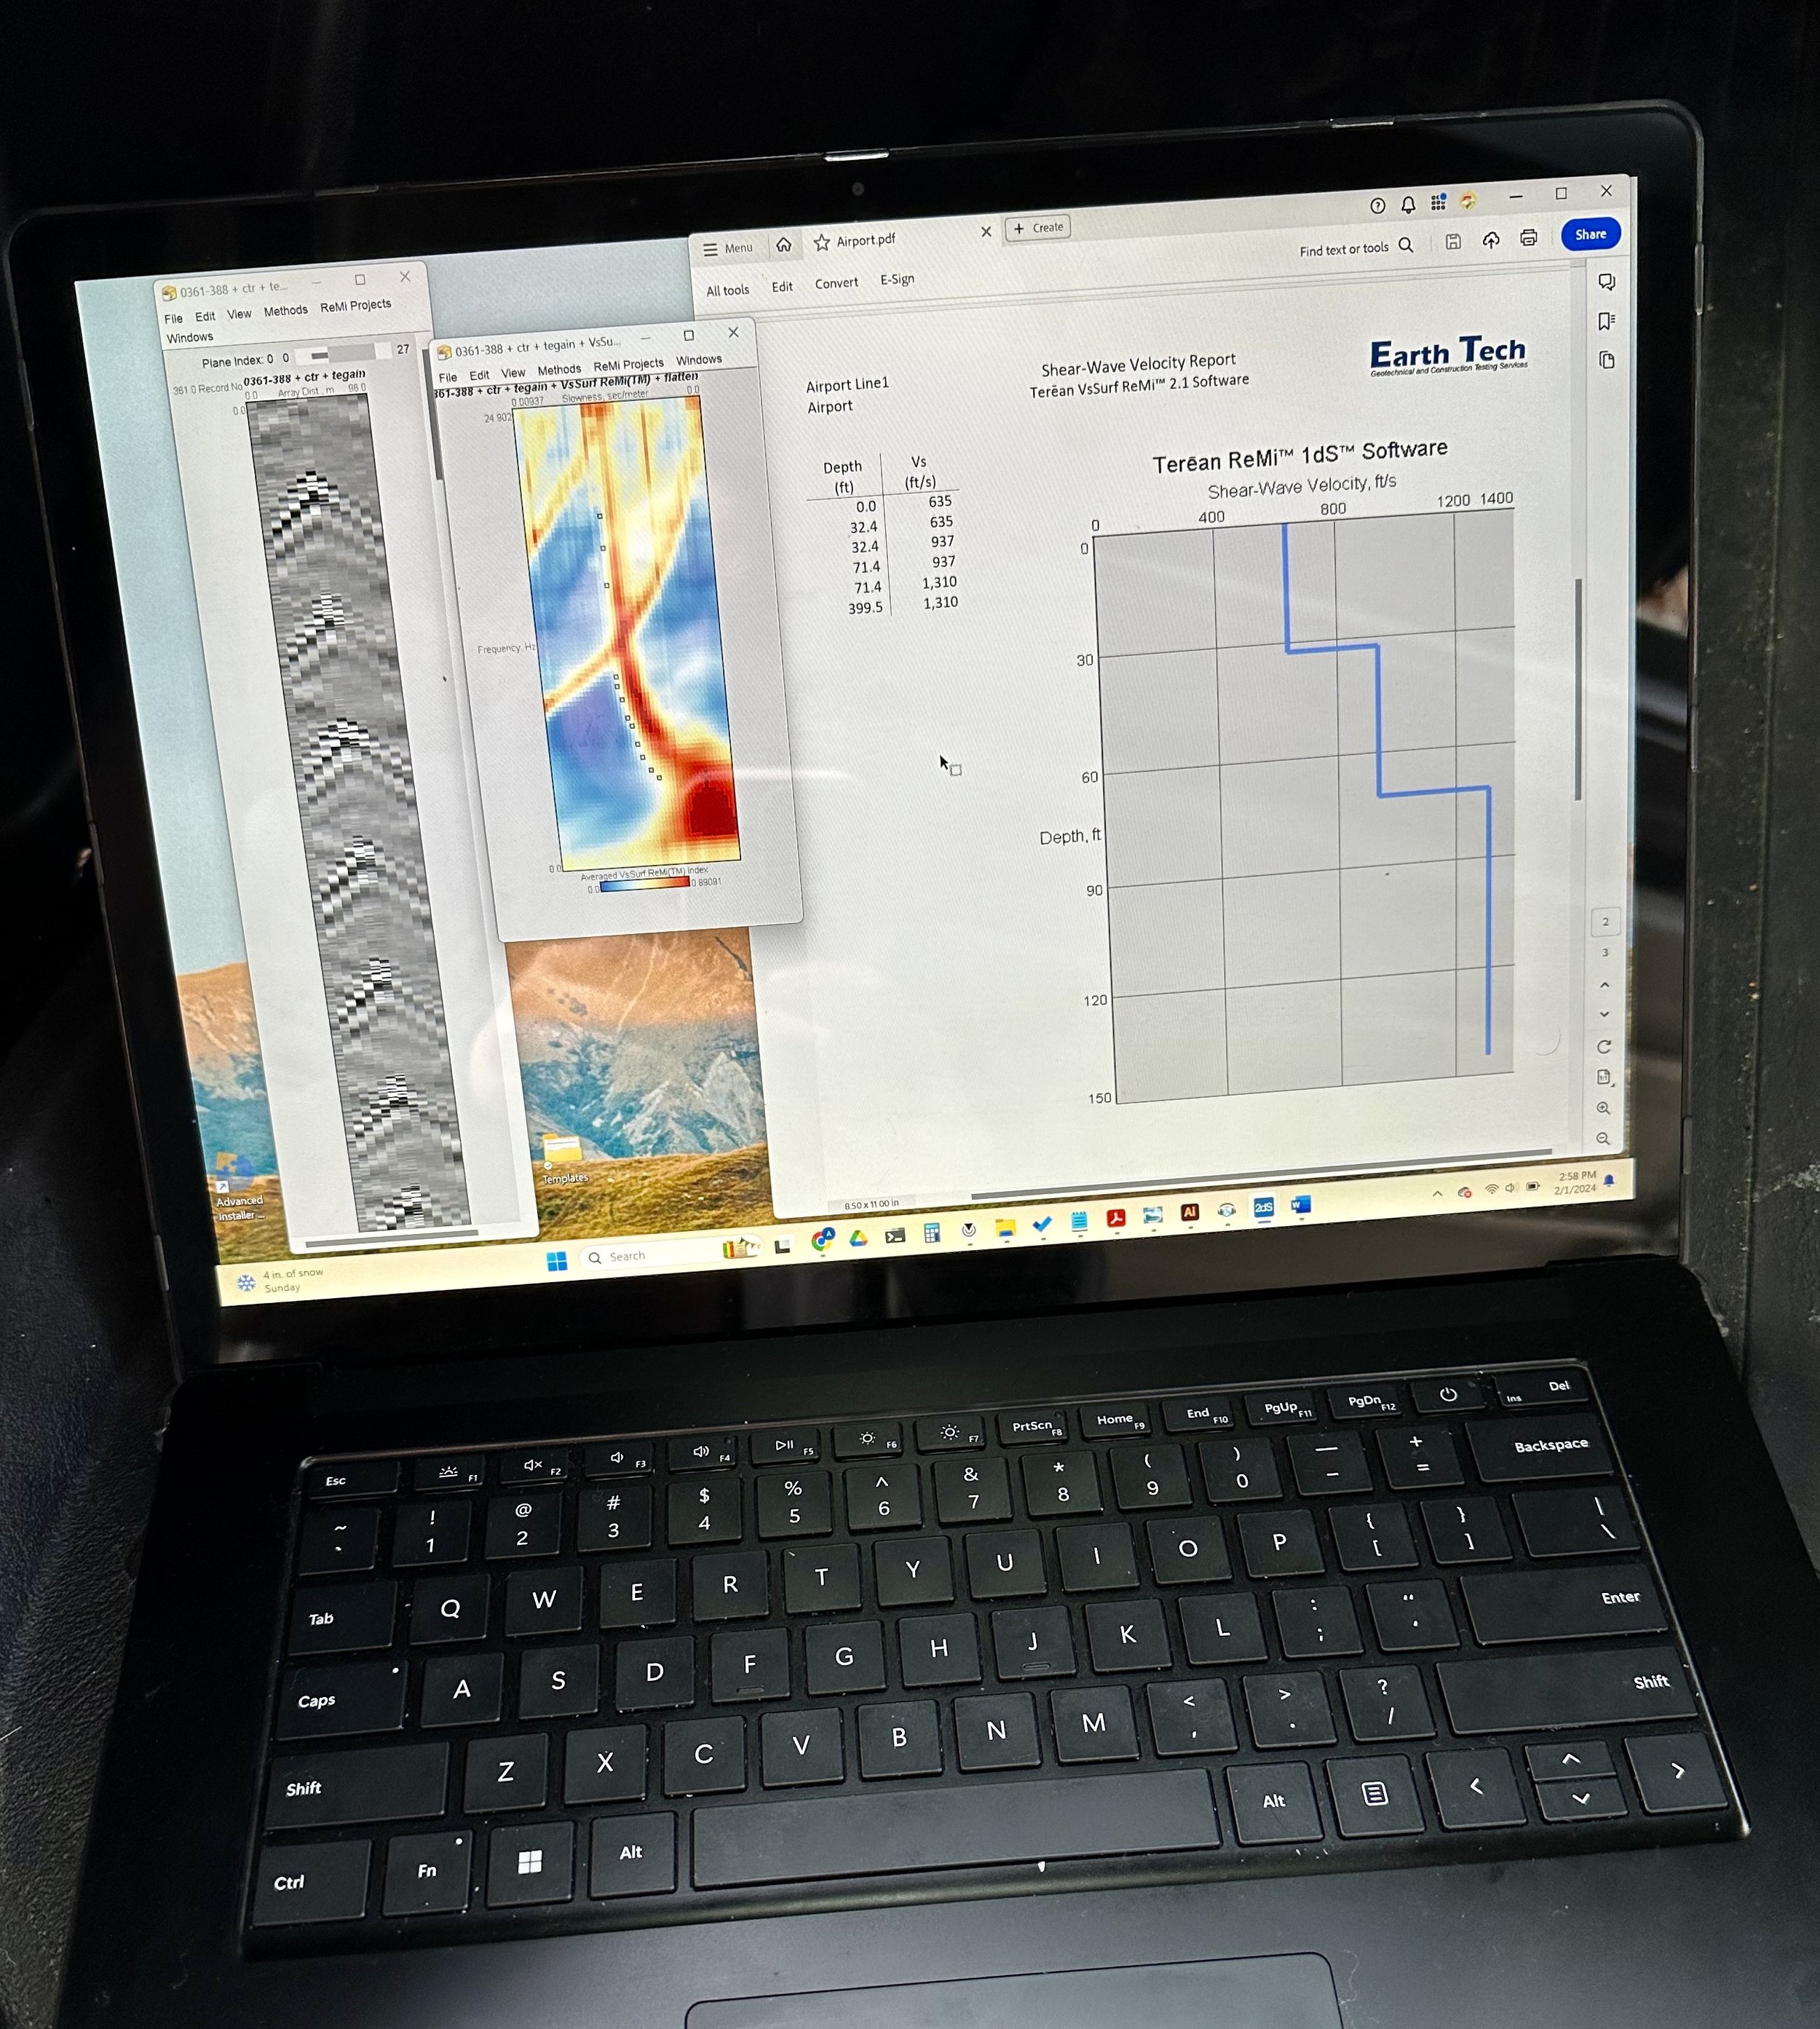
VsSurf 1dS® software for making 1D Shear (S-) wave depth-velocity profiles using passive and active seismic sources:
Determine earthquake ground shaking potential per National Earthquake Hazard Reduction Program ("NEHRP") and/or International Building Code ("IBC") - Vs100 (feet) / Vs30 (meters)
Constrain the depth and velocity of subsurface layers
Estimate density & rheology of earth & rock
Understand rippability and excavation costs
Reads both SEGY and SEG2 file formats
Auto-generate a final report

VsSurf 1dS software 1D S-wave velocity profile showing earthquake ground shaking potential site class per the International Building Code (IBC) and depth of subsurface layers.
VsSurf 2dS® software or On-Demand Processing (let us process your data for you) for 1D & 2D S-wave depth-velocity profiles using passive and active seismic sources:
Evaluating rippability
Imaging depth & velocity to reveal the lateral extent of subsurface layers
Locating potential faults
Modeling density & rheology of earth & rock (S-waves)
Differentiating ore & waste rock zones
Monitoring earthen structures (Tailings retention dams, reservoir dams, tailings piles, etc.)
Determining the effectiveness of ground remediation projects, such as pilings and compaction
Reads both SEGY and SEG2 file formats
Auto-generate a final report

VsSurf 2dS software 2D S-wave velocity image from fault study in Las Vegas Valley, USA. Caliche layer, shown in orange, overlies displaced velocity reversal, shown in purple, to constrain the location of a mapped fault at about offset 310 ft.
ēDAQ 5 Seismograph + Software Bundle The Bundle includes a 12- or 24-channel Seismograph + peripherals and 2 VsSurf software licenses:
Everything you need to independently and confidently use seismic methods for the benefit of your projects
Settings specified for use with VsSurf software
Wireless data transfer and user friendly VsSurf software analysis allows you to QA/QC in the field & generate a report while still collecting seismic data, from the comfort of your air conditioned or heated vehicle